
[Part 3] Debugging APIs Best Practices for Product Managers
[Part 3] Debugging APIs Best Practices for Product Managers
Stop waiting on engineering and start debugging errors yourself. Learn how to use Chrome DevTools and Postman to identify the root cause of API issues and speed up resolution times.

" height="20px" id="D2av7Oa6w" width="20px"/></svg>)
" height="20.035778175313055px" id="eWFuVHpu9" width="22.150617531305898px"/></svg>)
" height="20.19299259259259px" id="jW1ICukqX" transform="translate(0 0)" width="20.05540740740753px"/><path d="M 5.014 19.008 C 7.783 19.008 10.028 14.753 10.028 9.504 C 10.028 4.256 7.783 0 5.014 0 C 2.245 0 0 4.256 0 9.504 C 0 14.752 2.245 19.008 5.014 19.008 Z" fill="rgb(0, 0, 0)" height="19.00823703703702px" id="o80dVBhnW" transform="translate(21.028 0.592)" width="10.02800000000002px"/><path d="M 1.764 17.031 C 2.738 17.031 3.527 13.218 3.527 8.515 C 3.527 3.813 2.739 0 1.764 0 C 0.79 0 0 3.814 0 8.515 C 0 13.217 0.79 17.031 1.764 17.031 Z" fill="rgb(0, 0, 0)" height="17.030755555555572px" id="dzJnzwG1A" transform="translate(32.028 1.58)" width="3.527407407407395px"/></g></svg>)

If you missed Part 2 of this 3 part “Guide to APIs” series, check it out here.
You’re a product manager and you receive a complaint from your customer about errors using your app. What do you do? How do you respond? You might decide to ping an engineer and wait for them to implement a fix. After all, you’re not in the code and there’s only so much you can do.
But this couldn’t be further from the truth. Regardless of the cause, you can play an active part in resolving errors quickly by trying to understand as much about the cause of the error. For example, is it a user error, an issue with an internal API, or a third-party issue? To find out, you’ll need to learn how to debug an API as a core technical skill.
So in this tech essay, I’ll go over useful tools and methodologies for debugging APIs more quickly and reliably.
Tools for Debugging APIs
Before we dive deeper into the steps for debugging an API, let’s go over a couple of popular tools we can use in the process.

A PDF Guide to APIs, Designed for PMs
Get a clear understanding of what APIs are and why they matter for maximizing product success.
Developer Tools
Developer tools, or DevTools for short, are a set of software tools that help developers debug, test, and optimize web apps. Developer Tools are built directly into the browser and developers use them on a regular basis to inspect the frontend code of a web page, view network activity, debug JavaScript, and more.
For example: Google Chrome’s Developer Tools, also known as Chrome DevTools, is a popular web developer tool that’s built directly into the Google Chrome browser. You can check out Chrome’s DevTools yourself by opening up Chrome -> Click “View” -> Hover over “Developer” -> Click “Developer Tools”, or you can use the shortcut “Option + Command + i” (“Option + Control + i” for PC).
There are a number of tabs in DevTools, each serving a specific purpose. For this essay on debugging APIs, we’ll focus on the “Network” tab and the “Console” tab.
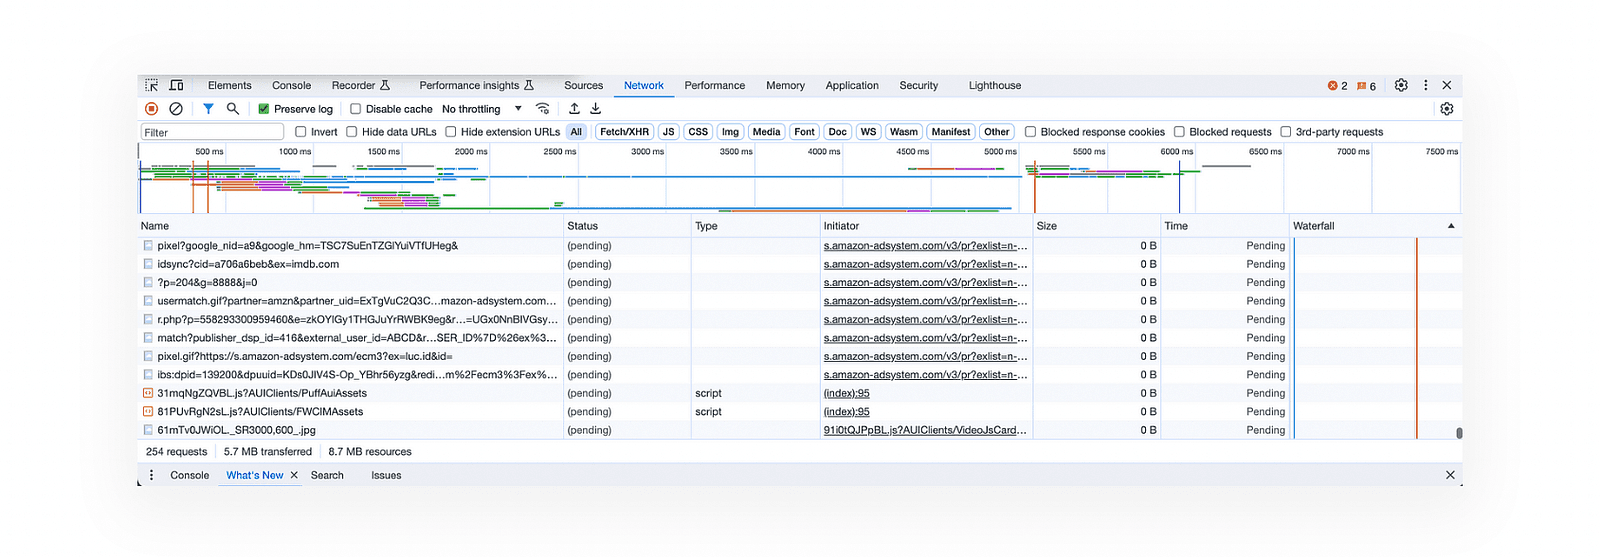
In the “Network” tab, you’ll see all the network interactions between your browser and the server-side (backend) through APIs:
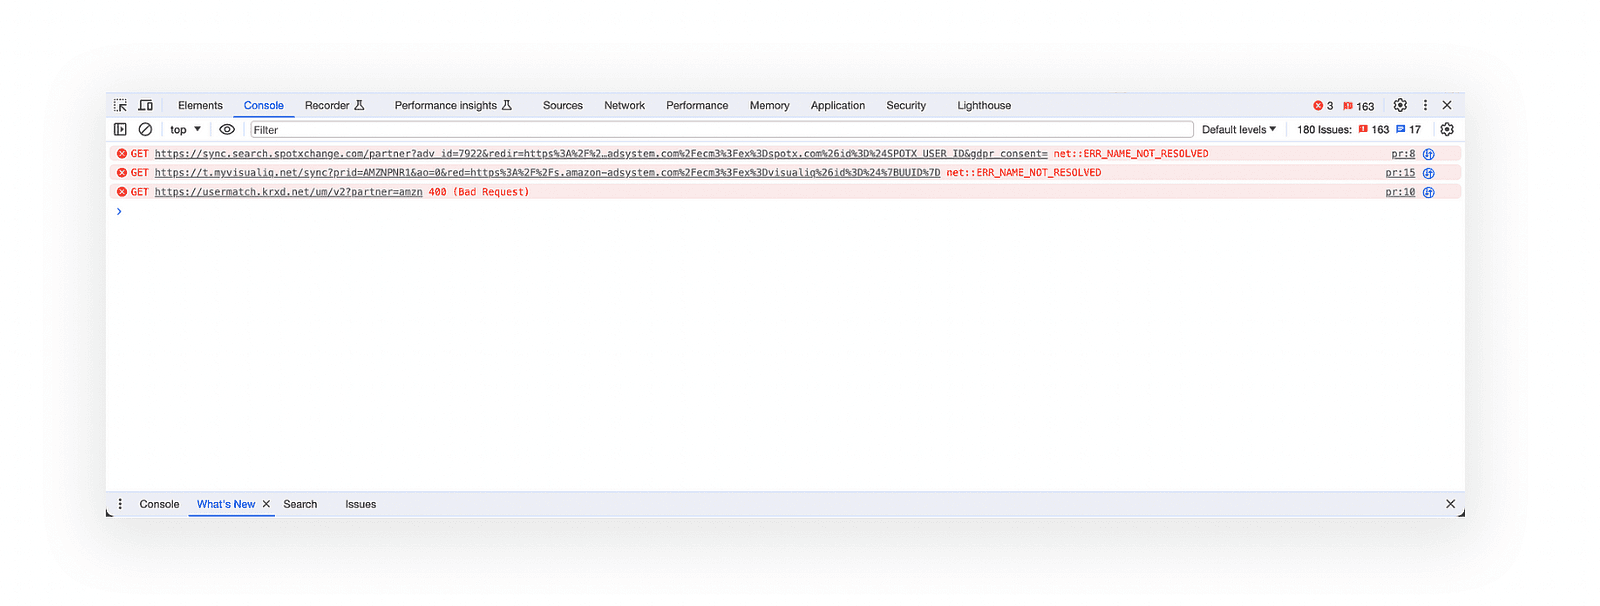
The “Console” tab allows you to interact with web pages and web applications. It is a command-line interface that provides a way to execute JavaScript code, log messages, and debug code:
Postman API
If you’ve been working in tech for a while, you’ve likely interacted with or at least heard of Postman. Postman API is a popular app that simplifies the process of building, using and testing APIs. It offers a comprehensive set of tools that help accelerate the API lifecycle — from design, testing, and documentation to the mocking and sharing of APIs.
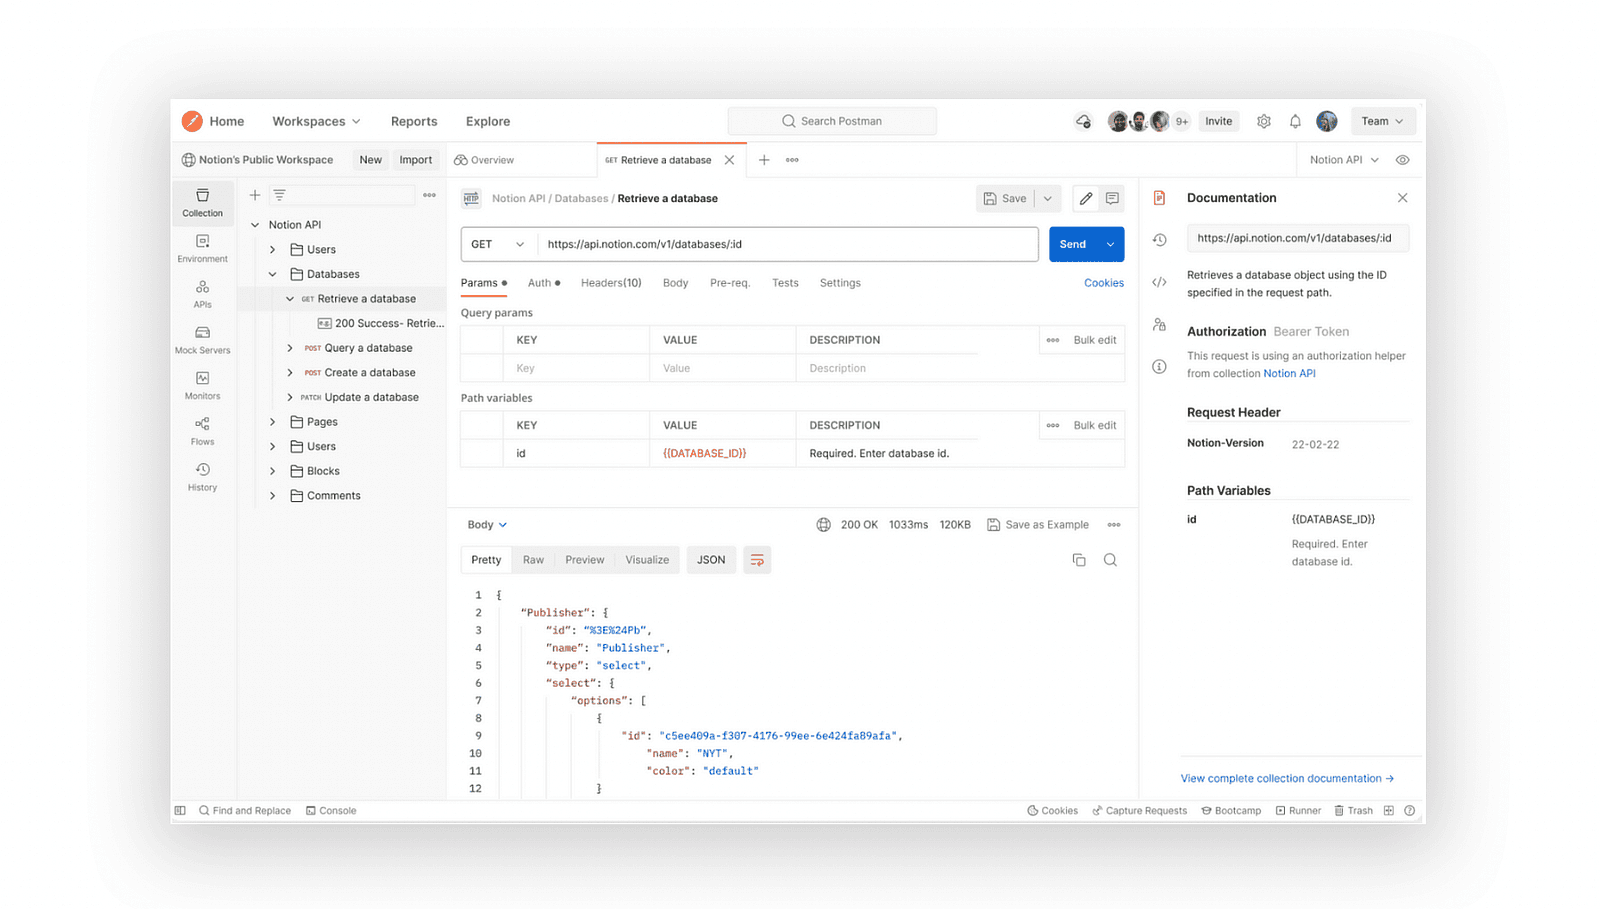
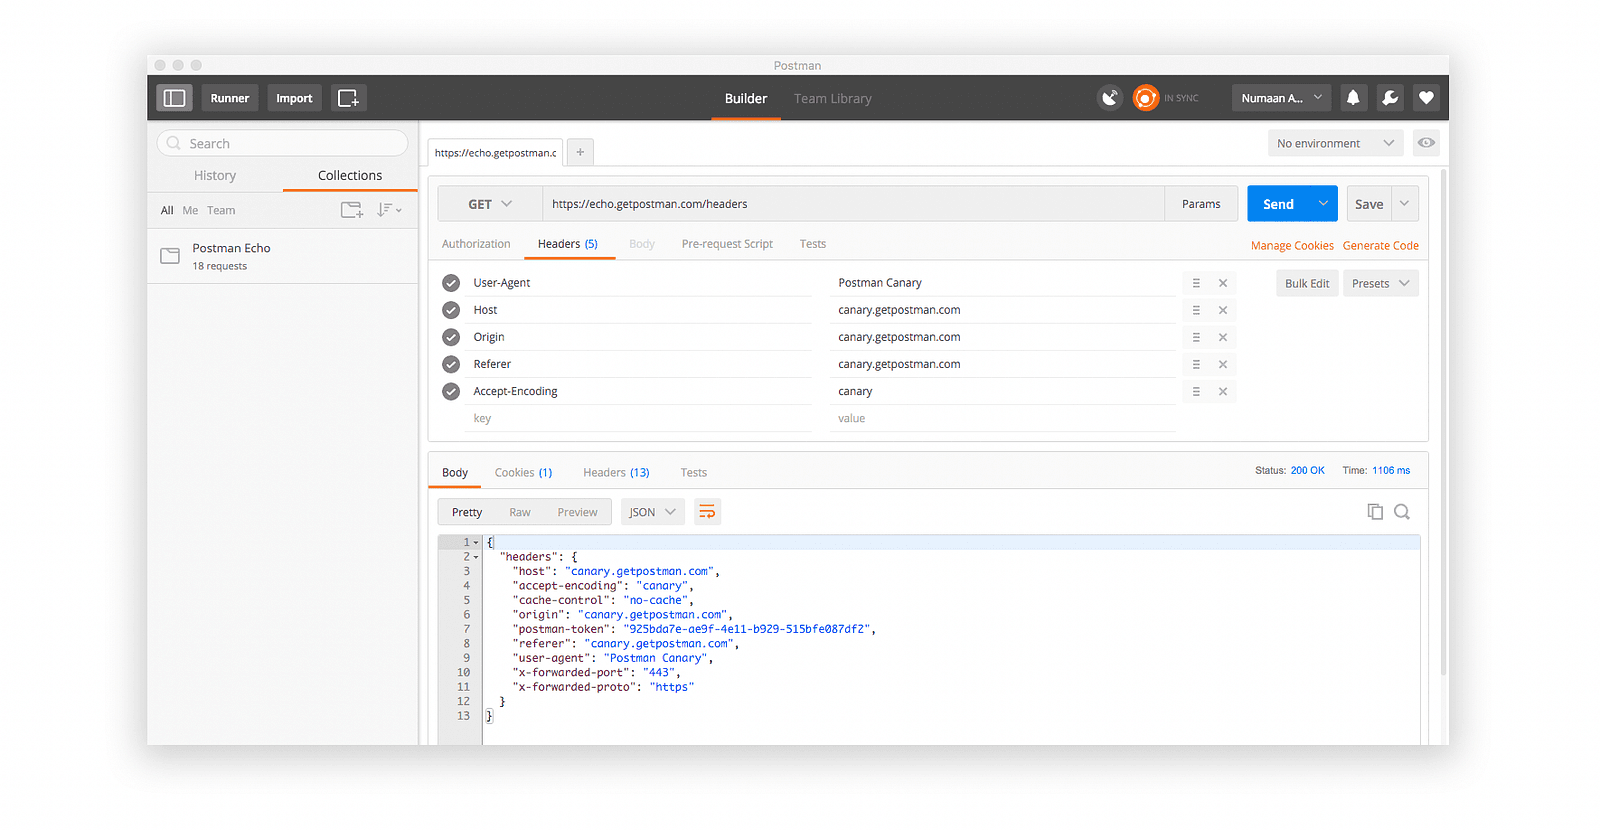
Postman is a great tool for debugging APIs. It provides a simple and intuitive UI where we can make API calls and play around with the inputs (request attributes) to see the effects on the outputs (response). Here’s what it looks like:
How to Debug an API
Alright, now that you’re familiar with the tools, let’s jump into how to debug an API.
The first step to debugging any error is getting as much information as possible from the user about what they’re experiencing. Ask them for the exact steps to reproduce the error including text they’re entering into a form. Screenshots are also very helpful.
From there, you can try and reproduce the error yourself to identify if it’s a user error or something else. If it doesn’t appear to be a user error, we want to start looking at API requests happening and debug them.
Debugging an API means identifying and fixing issues with a single API call or sequence of calls. This requires you to understand what the relationship is between the inputs (API request) and outputs (API response) and then locating the root cause of the issue based on those inputs and outputs. This understanding will help reduce the time and effort required for your team to find and fix the issue.
The steps for debugging an API can be broken down into four parts:
Identify the problematic API
Check the status code and response
Examine the API data more closely
Experiment with the API inputs
Step 1: Identify the problematic API
The first step to debugging an API issue is to identify which API(s) are causing the issue. To do this, you want to reproduce the error with developer tools open. For the rest of the essay we’ll use Chrome’s Developer Tools as an example.
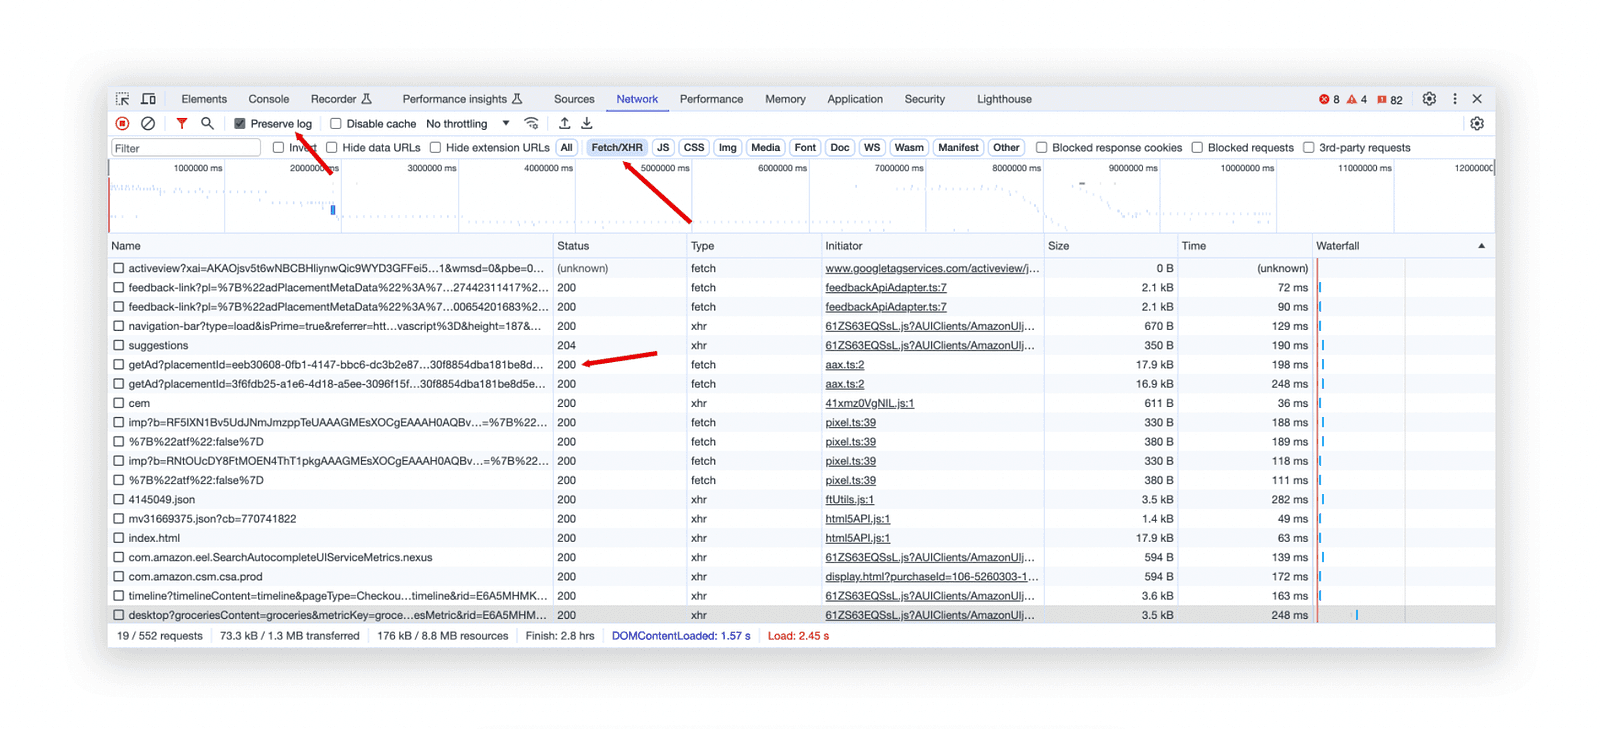
After opening up Chrome’s Developer Tools, click on the “Network” tab and filter for Fetch/XHR. This will show you all the API requests that’s being made from the website. If you don’t see any or many API requests, check “Preserve Log”, reload the page, and re-do the steps needed to reproduce the error.
From here, you can check the API status code. Identify the ones that aren’t 200 meaning they were not successful.
Step 2: Check the status code and response
Our first clue for debugging the problematic API(s) is by looking at its status code and then it’s error message. APIs return a HTTP status code that represents whether the request was successful, or something went wrong in which case an error message is returned in the response. No two APIs are exactly the same since status codes and error messages are not automatically assigned. They’re created by the API provider and they decide how much information they want to include or not include.
However, status codes tend to be fairly standard as they follow an established convention. For example, all status codes in the 200s indicate the API functioned perfectly and as intended. Status codes in the 400s indicate a bad request was made by the client and therefore it’s an issue you can potentially solve. Status codes in the 500s indicate there was an issue on the server-side which requires a more involved process for debugging since it’s an issue that needs to be fixed by the API provider.
Here are some common 400 status error codes and what you can do when you encounter one of these errors:
400 Bad Request: Check if you’re missing data required by the API request or if there was a typo.
401 Unauthorized: Check if your authentication credentials are valid. They’re usually included in the headers.
403 Forbidden: Check your permissions and scope to ensure you are authorized to access the resource.
429 Too Many Requests: The API rate limit might have been hit. Wait for some time and try again later.
If you encounter any of these status codes, you’ll likely also find an error message that might give you a little more information about what the issue is and how to possibly fix it.
Step 3: Examine the API data more closely
After examining the status code and the error message, the next step is to dig deeper and examine all parts of the API. You want to check the API endpoint, any endpoint parameters, the headers, and the API request body. You can do this in developer tools.
For example, the API endpoint will tell you if the API is internal, or if it’s a third-party API. However, oftentimes internal APIs are integrated with third-parties behind the scenes so it may not be immediately obvious that it’s a third-party issue. Providing the API endpoint to your dev team will help them quickly trace the business logic to the source. From there, you may be able to play a part in communicating with the third-party to try and resolve the issue depending on who the third-party is.
Authentication and authorization issues are also commonly found in the API header. Authentication is the process of verifying that users are who they claim to be, while authorization is the process of confirming that users have the necessary permissions to access a resource. You want to check if the authentication and authorization issue is specific to this user, if it’s a user error, or a broader issue that needs to be addressed by engineering.
Step 4: Experiment with the API inputs
Finally, you want to experiment by playing around with the inputs — changing parameters, updating the headers, and including or excluding data in the request body. See how different inputs change the output which may provide you with a possible fix or more information about the issue.
A great and easy way to do this is to use Postman. With Postman, you can re-create the API request and easily change the inputs, press “Send” and see if and how the output changes.
Last Thoughts
There are many benefits to learning how to debug APIs on your own as opposed to sitting around waiting for developers to fix the issue. Not only will you contribute to a faster resolution time which is a better experience for customers, but you’ll also get appreciation from your dev team by coming to them with solutions rather than problems and asks.
While you’re not expected to code and don’t require the same level of depth in technical understanding as engineers, learning the technical skills to play an active role throughout the life of your product is extremely empowering and rewarding.
As a product manager, you’re an integral part of the team and have an active role to play throughout the life of your product — from planning, designing, building, and shipping to improving the product and maintaining it throughout its’ lifetime.
[Part 3] Debugging APIs Best Practices for Product Managers